
Introduction
Al-Quds University instituted the tracking and mitigation of the ramifications of our operations on the environment and on Green House Gas emissions as part of our commitment to environmental responsibility. The University recognizes the complexity of climate change and the necessity of engaging all institutions, higher education included, on the challenge. This report details the GHG emissions inventory undertaken in 2023, in accordance with the GHG Protocol Corporate Standard, the most internationally recognized standard for government leaders and businesses in the management, quantification, and understanding of GHG emissions.
1.1 Year of the Conducted Inventory
In 2023, Al-Quds University operations was subject to the comprehensive GHG emissions inventory, as part of the internationally recognizied best practices for tracking and reducing our carbon footprint, and determining the levels of sustainability in our operations and the GHG emissions ramifications of our operations.
1.2 The Importance of GHG Emissions Inventory
Our emissions inventory is a between step strategizing within the wider climate change strategic plan. It is an important step to measure and assess the GHG emissions. It is a global climate change mitigation action and provides a measure of our emissions over a period of time. It also informs the strategizing of our emissions within the GHG emission reductions targets.
1.3. Data Collection and Calculation Methodology
Our GHG emissions inventory is a multi-step approach that involves the collection of emissions data and the application of accepted calculation techniques to determine emissions quantities.
In the compilation of our GHG emissions inventory, data collection involves a representative data scope of our GHG emissions. To aid our scope, we covered data collection from the following core sources:
- Invoices: Utility invoices detailed data concerning the campus energy use, gas and electricity consumption, and the monthly energy consumption tracking.
- Suppliers: Emissions data from our suppliers were also considered, especially from transport fuel and refrigerant emissions used within our systems.
- Financial Reports: In our internal financial records analyses, we identified expenditures associated with indirect GHG emissions for some goods and services. These included ICT hardware and telecommunication services, business travel, security and cleaning services.
- Surveys: To understand staff commuting patterns, we conducted surveys with our staff, faculty, and students.
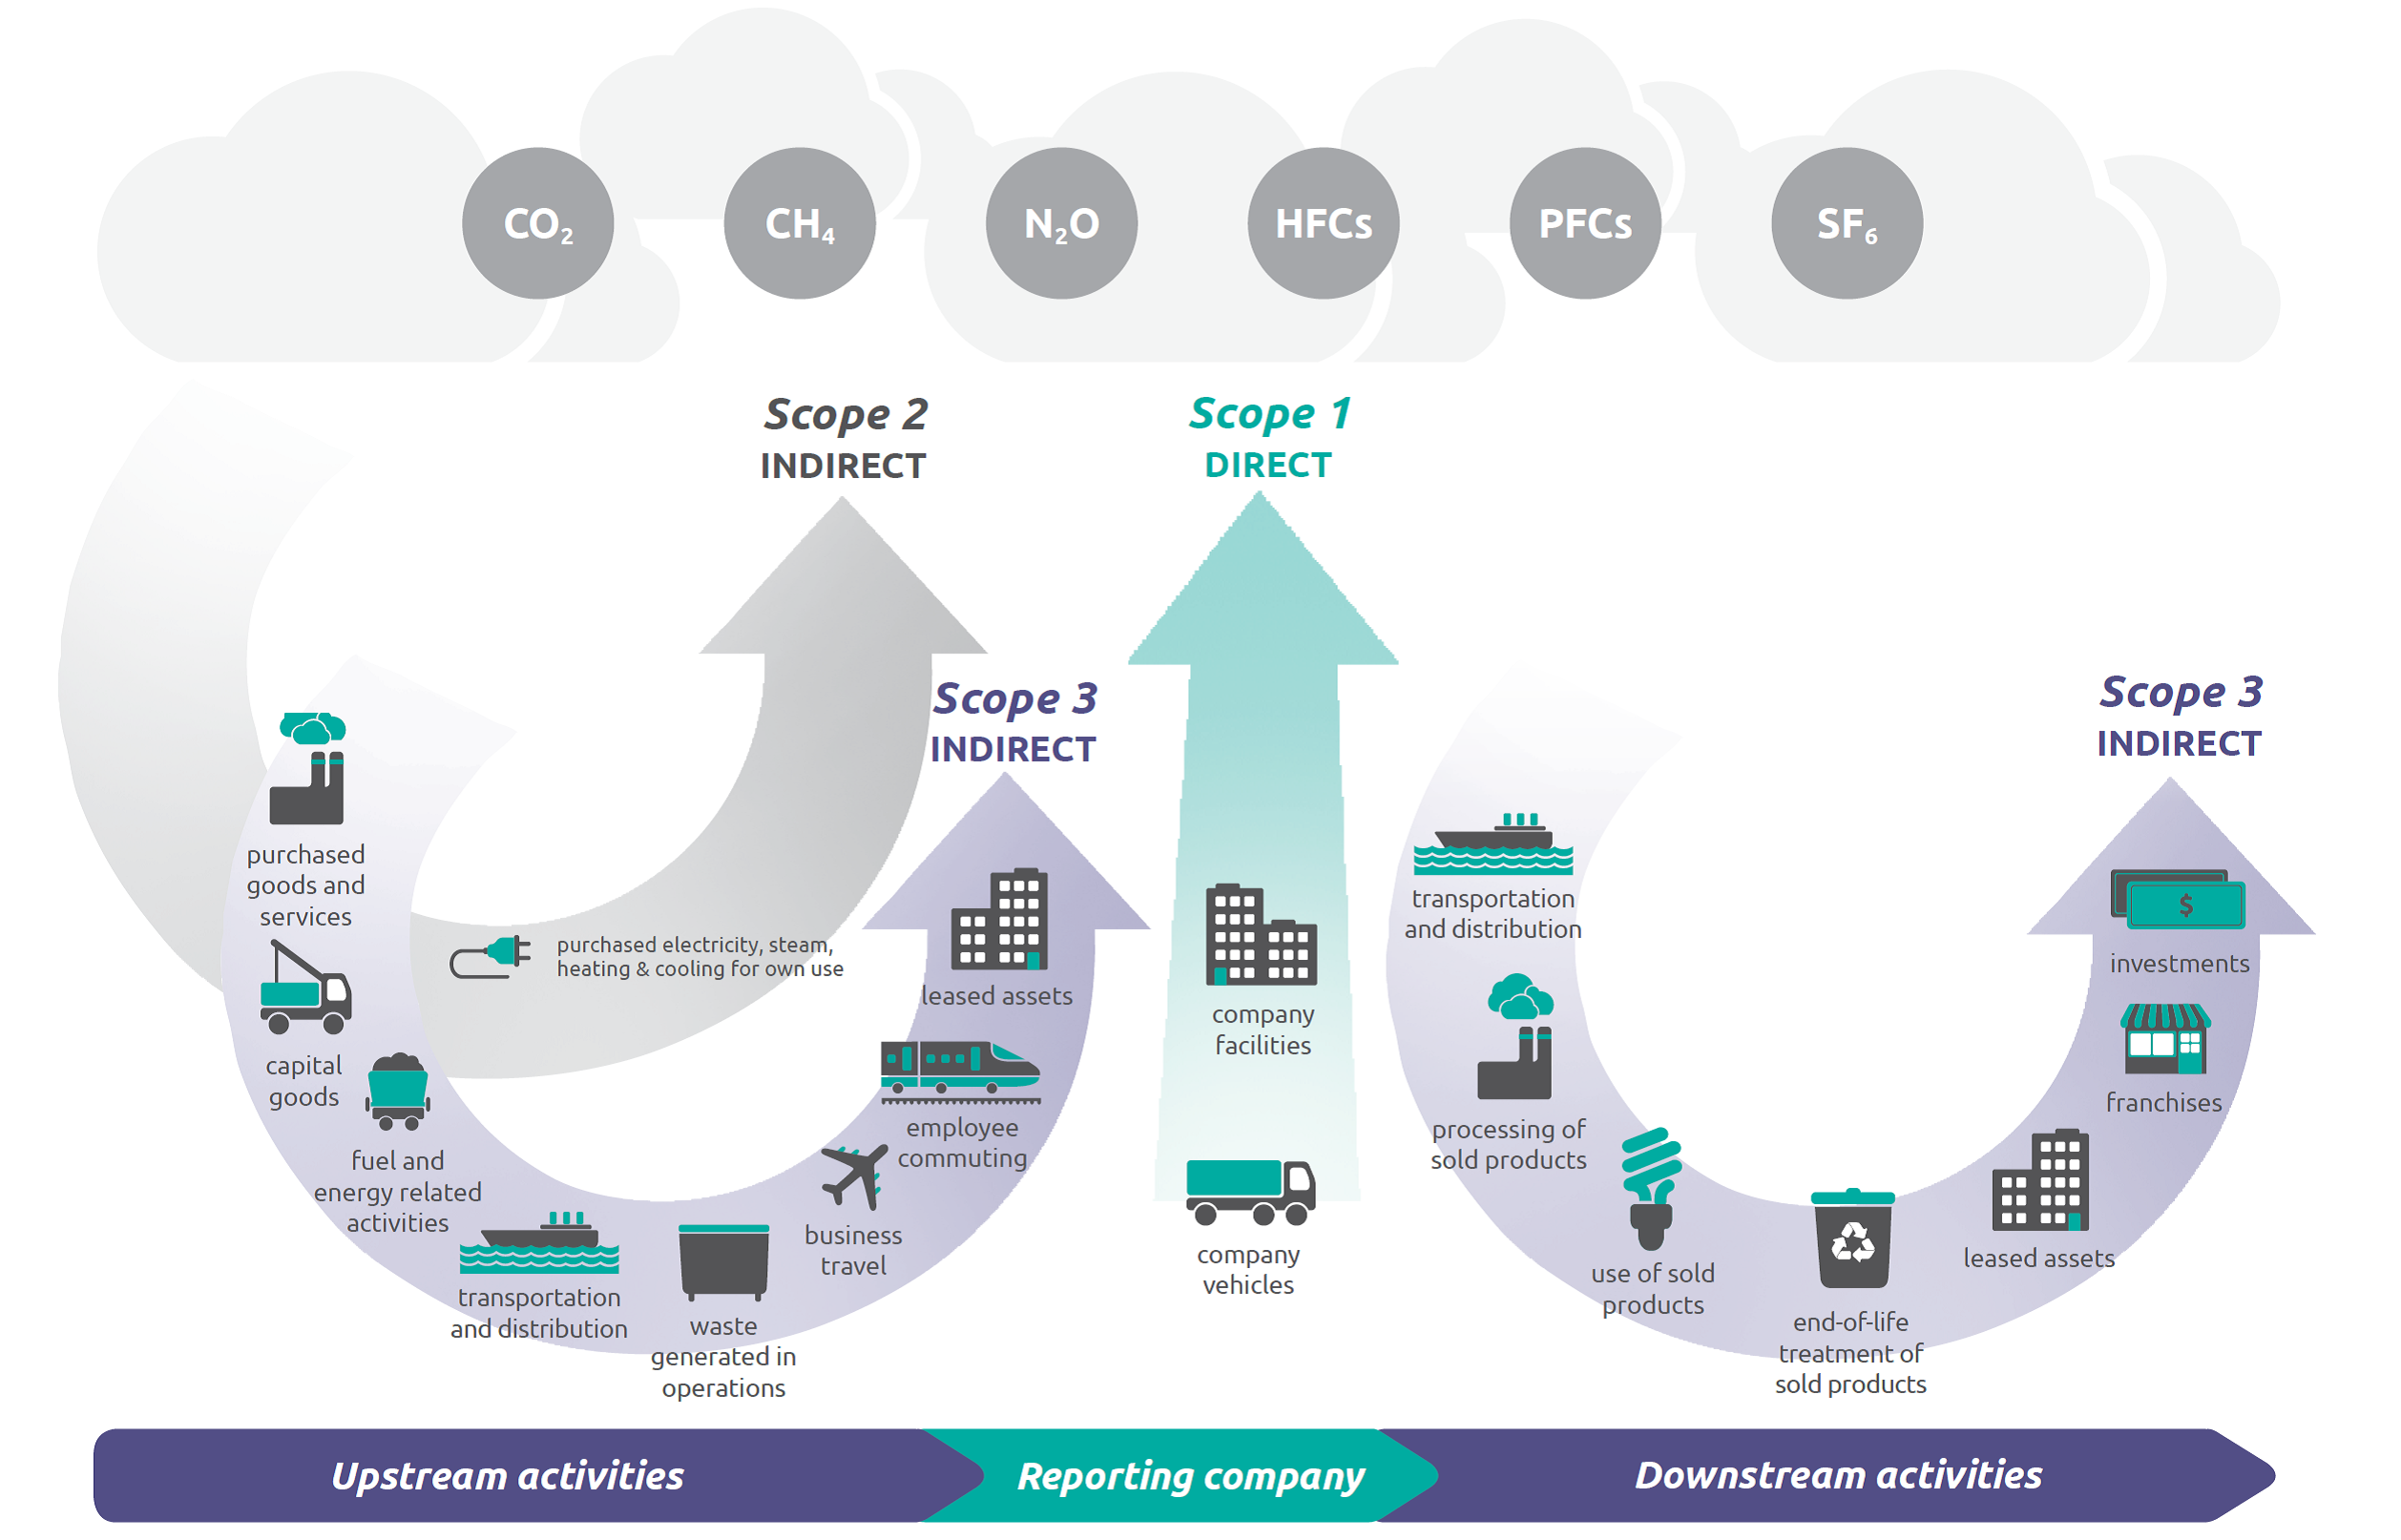
Data collected were subjected to quantification processes and GHG Protocol Corporate Standard which apportions greenhouse gas emissions to different scopes. Each scope consists of different calculations.
Scope 1: Direct GHG Emissions: Direct GHG emissions come from sources that fall under the ownership or control of Al-Quds University. These emissions come from the burning of gas and transport fuels, and the use of refrigerants in our cooling systems. For every type of fuel, we adopted standard emission factors. Emission factors are a predetermined value which converts activity data, for instance the volume of gas combusted, into GHG emissions. Emission factors denote average GHG emission rate for a specific source relative to measures of activity.
Scope 2: Energy Indirect GHG Emissions: We calculate and track emissions financially associated with the electricity we purchase and use. It is estimated through the total consumption of electricity and an associated emissions factor. An emissions factor is defined as the average emissions generated per unit of electricity consumed in addition to the method used to produce the electricity.
Scope 3: Other Indirect GHG Emissions: These emissions come from sources that are not owned or controlled by Al-Quds University yet are still activities attributable to them. These are perhaps the hardest emissions to calculate, and to the extent that they are measurable, they make a large contribution to the overall carbon footprint. To estimate emissions for Scope 3, we primarily used expenditure data from the surveys, financial reports, and invoices, combined with appropriate emissions factors. An example is the emissions from staff commuting, for which we used a commuting survey and emissions factors based on the transport mode and distance to estimate the emissions from to and from work commute.
Impact of the COVID-19 Pandemic on Greenhouse Gas Emissions at Al-Quds University
Looking at Al-Quds University’s GHG (Greenhouse Gas) emissions from 2019 to 2023, there appears to be some volatility. 2019 and 2023 showed comparatively high GHG emissions, while 2020 and 2021 experienced a significant drop in emissions. These variations can be understood in the context of the COVID-19 global pandemic and the operational changes at the university.
In response to the global health crisis, Al-Quds University implemented remote learning and limited in-person university activities from March 2020 to December 2021. GHG emissions during this period, especially from the university’s owned vehicles, student and staff commuting, and the university’s buildings and facilities, significantly dropped because there was less travel and energy use.
Furthermore, many university operational elements that incur Scope 3 emissions, such as purchase and disposal of waste, were also considerably less during this period because of the reduced operational scale of the university.
With the reopening of the University, we expect the GHG emissions to increase again like in 2022. This gives the University a chance to reevaluate the carbon emissions and figure out how to operate in a more sustainable way in the post Covid era.
GHG Inventory Calculations
For the GHG inventory, we used the GHG Protocol Corporate Standard, which incorporates the 3 scopes of emissions.
3.1 Scope 1 – Direct GHG Emissions
The University Owned sources of Direct Emissions include the combustion of fuels in the University controlled boilers, furnaces, and vehicles, as well as in the process equipment, and chemical emissions that are produced in controlled process equipment.
In 2023 we used a bottom up approach to scale and document emissions from the following sources.
3.1.1 Natural Gas
Al-Quds University is still trying to monitor and mitigate GHG emissions and as part of that we are documenting the use of Natural Gas. This document will highlight the Scope 1 direct emissions that occur from our Natural Gas use. All calculations used 2019 as the baseline year.
To determine GHG emissions as a result of our use of natural gas, we calculated GHG emissions by gas consumed multiplied by gas emission factor. The emissions factor for butane, as used from IPCC, is about 3.01 kg CO2 per kg of butane burned. Our consumption of natural gas as measured in kg where 1 cylinder of gas is 12 kg of butane. The GHG emissions as calculated are thus expressed in kg of CO2.
The following is a GHG emissions estimation and natural gas consumption report by year:
| Year | Natural Gas Consumption (kg) | Estimated GHG Emissions (kg CO2) | Estimated GHG emissions (tCO2e) |
| 2019 | 34 cylinders * 12 kg/cylinder = 408 kg | 408 kg * 3.01 kg CO2/kg = 1,228 kg CO2 | 1.228 |
| 2020 | 7 cylinders * 12 kg/cylinder = 84 kg | 84 kg * 3.01 kg CO2/kg = 253 kg CO2 | 0.253 |
| 2021 | 4 cylinders * 12 kg/cylinder = 48 kg | 48 kg * 3.01 kg CO2/kg = 144 kg CO2 | 0.144 |
| 2022 | 17 cylinders * 12 kg/cylinder = 204 kg | 204 kg * 3.01 kg CO2/kg = 614 kg CO2 | 0.614 |
| 2023 | 12 cylinders * 12 kg/cylinder = 144 kg | 144 kg * 3.01 kg CO2/kg = 433 kg CO2 | 0.433 |
Consideration should be given to the fact that the values given are estimations. For example, there are variations in the efficiency of the appliances using gas and the exact type of gas being used with the appliances. That said, there is enough information to provide a ballpark figure of GHG emissions made from natural gas which is useful in establishing reduction goals and tracking progress made toward those goals.
In the pursuit of a 2050 (or sooner) net GHG emissions goal of zero, the organization strives to keep reducing the emissions made from natural gas. This organization hopes to cut the emissions made from gas further, based on prior analysis of gas usage. The organization is confident that its effort will be significant in the battle against climate change.
For Al-Quds University, there is a commitment to transparency in emissions, which is continuously elaborated on, and there is enacted adaptive change in the strategic plan. The organization is confident that every incremental change, even if it is small, is progress in the effort of building a durable and adaptive future.
3.1.2 Non-Transport Fuels
We also use non-transport fuels for our operations. These include fuels for campus generators, maintenance machinery, and other campus operations. The GHG emissions for non-transport diesel fuel can be calculated using the emissions factor for diesel fuel. The United States Environmental Protection Agency (EPA) states the emissions factor for diesel fuel combustion is about 2.688 kg CO2/litre.
Below is the estimated GHG emissions from diesel fuel used at Al-Quds University for non-transport purposes:
| Year | Diesel Consumption (litres) | Estimated GHG Emissions (kg CO2) | Estimated GHG emissions (tCO2e) |
| 2019 | 650 litres | 650 litres * 2.688 kg CO2/litre = 1,747.2 kg CO2 | 1.7472 |
| 2020 | 130 litres | 130 litres * 2.688 kg CO2/litre = 349.44 kg CO2 | 0.34944 |
| 2021 | 180 litres | 180 litres * 2.688 kg CO2/litre = 483.84 kg CO2 | 0.48384 |
| 2022 | 470 litres | 470 litres * 2.688 kg CO2/litre = 1,263.36 kg CO2 | 1.26336 |
| 2023 | 590 litres | 590 litres * 2.688 kg CO2/litre = 1,585.92 kg CO2 | 1.58592 |
As illustrated by the numbers, the university was able to significantly decrease diesel consumption after 2019, with a small increase in 2023. The decline in diesel consumption is a positive step in mitigating the university’s carbon footprint. Nonetheless, it must be pointed out that the numbers provided in this context remain estimative. Concerning the emissions, several factors might include the generators’ efficiency and the diesel’s exact constituents.
3.1.2 Transport Fuels
To identify the emissions generated by transport fuel, the fuel used in university-owned and operated vehicles was encompassed in our direct emissions. With respect to greenhouse gas emissions from transport fuel, we ought to rely on the diesel combustion emissions factor from the US Environmental Protection Agency (EPA) which is around 2.688 kg CO2 per litre. In this case, let us perform estimations with the provided fuel consumption data. Al-Quds University directly operated a large bus and two small buses which are integral for the university operations. The fuel consumption of those vehicles constitute the institution’s gas emissions.
Here is how much GHG emissions diesel fuel burnt in university-owned and operated vehicles is estimated to produce:
| Year | Diesel Consumption (litres) | Estimated GHG Emissions (kg CO2) | Estimated GHG emissions (tCO2e) |
| 2019 | 5200 litres | 5200 litres * 2.688 kg CO2/litre = 13,977.6 kg CO2 | 13.9776 |
| 2020 | 1800 litres | 1800 litres * 2.688 kg CO2/litre = 4,838.4 kg CO2 | 4.8384 |
| 2021 | 1600 litres | 1600 litres * 2.688 kg CO2/litre = 4,300.8 kg CO2 | 4.3008 |
| 2022 | 4300 litres | 4300 litres * 2.688 kg CO2/litre = 11,558.4 kg CO2 | 11.5584 |
| 2023 | 4800 litres | 4800 litres * 2.688 kg CO2/litre = 12,902.4 kg CO2 | 12.9024 |
In the context of our future sustainability climate action plan, Al-Quds University could consider purchasing more fuel-efficient cars, or possibly even electric and hybrid cars. Continuously reducing fuel consumption and monitoring fuel consumption will be key to achieving our goal of net zero emissions by 2050 or earlier.
3.1.2 Refrigerant Gases
We also included emissions from refrigerant gas leakage from cooling equipment in the inventory, which combined the total refilled refrigerant during the period, GWP of each refrigerant, and leak rate per refrigerant. Refrigerant gas leakage accounted for an emissions total of 200 metric tons of CO2 eq. of GHG.
Refrigerant gas is used in vehicle air conditioners, building air conditioners, kitchen refrigeration, and in various cooling lab equipment. These gases have high global warming potential, and thus, constitute GHG emissions for the University. In this section, we will calculate the GHG emissions of refrigerant gases used from 2019 to 2023.
Refrigerant gas R134a is used for refrigeration and R410a is used for air conditioning. The GHG emissions from these gases is determined by multiplying the mass of refrigerant gas added to the system ( in kg) by the gas’s global warming potential (GWP). GWP is the estimated measure of the contribution of a given mass of greenhouse gas relative to the mass of CO2 ( GWP = 1) for the global warming over the next 100 years.
As per IPCC (2007), GWP of R134a is 1430 and R410a is 2088.
Emissions are reported in metric tonnes of carbon dioxide equivalent (tCO2e) to make different greenhouse gases comparable to 1 unit of CO2.
Here’s a summary of refrigerant gases at Al-Quds University.
2019:
- Refrigerators (R134a): 840 grams = 0.84 kg, Emissions = 0.84 kg * 1430 GWP = 1.20 tCO2e
- Air Conditioning (R410a): 6430 grams = 6.43 kg, Emissions = 6.43 kg * 2088 GWP = 13.42 tCO2e
- 2019 total: 14.62 tCO2e
2020:
- Refrigerators (R134a): 0 grams = 0 kg, Emissions = 0 kg * 1430 GWP = 0 tCO2e
- Air Conditioning (R410a): 400 grams = 0.4 kg, Emissions = 0.4 kg * 2088 GWP = 0.8352 tCO2e
- 2020 total: 0.8352 tCO2e
2021:
- Refrigerators (R134a): 306 grams = 0.306 kg, Emissions = 0.306 kg * 1430 GWP = 0.43758 tCO2e
- Air Conditioning (R410a): 960 grams = 0.96 kg, Emissions = 0.96 kg * 2088 GWP = 2.00448 tCO2e
- 2021 total: 2.44206 tCO2e
2022:
- Refrigerators (R134a): 630 grams = 0.630 kg, Emissions = 0.63 kg * 1430 GWP = 0.9009 tCO2e
- Air Conditioning (R410a): 3250 grams = 3.25 kg, Emissions = 3.25 kg * 2088 GWP = 6.786 tCO2e
- 2022 total: 7.6869 tCO2e
2023:
- Refrigerators using R134a refrigerants contain 473 grams of R134a refrigerants which is equal to 0.473 kg. By using the GWP of 1430, the GHG emissions associated with that amount of refrigerants is to the order of 0.6764 tCO2e.
- Air conditioning systems that use R410a refrigerants and are equipped with 2430 grams of which is equal to 2.43 kg. The GWP of R410a is 2088 and using that number, the GHG emissions associated with that refrigerant is 5.0738 tCO2e.
- The total GHG emissions that are associated with refrigerants in the year of 2023 is accounted to be 5.7502 tCO2e.
| Year | Refrigerators (R134a) emissions (tCO2e) | Air Conditioning (R410a) emissions (tCO2e) | Total GHG emissions from refrigerant gases (tCO2e) |
| 2019 | 1.2 | 13.42 | 14.62 |
| 2020 | 0 | 0.8352 | 0.8352 |
| 2021 | 0.43758 | 2.00448 | 2.44206 |
| 2022 | 0.9009 | 6.786 | 7.6869 |
| 2023 | 0.6764 | 5.0738 | 5.7502 |
Al-Quds University has taken steps to actively manage the eco-sustainability of our operations. For instance, even abated refrigerant gas losses emit negative CO2 emissions on an annualized average. All the losses of refrigerant gas emissions are compensated annually by an abatement of losses on negative CO2 emissions! Al-Quds have taken pragmatic steps to mitigate emissions and losses. We safeguard losses and have applied practical eco-sustainability measures. Negative CO2 emissions demonstrate the extent of eco-sustainability actions undertaken by Al-Quds University. These actions set Al-Quds University ahead of the curve in eco-sustainability efforts. We oversee, safeguard losses, and thus have applied practical eco-sustainability measures to preserve our environment as Al-Quds University has instituted. Al-Quds University has coordinated practical measures to cause an abandoned industrial approach to eco-sustainability in operational aspects of the University.
3.2 Scope 2 – Energy Indirect GHG Emissions
One of the critical components of a sustainability strategy is evaluating and reducing greenhouse gas (GHG) emissions. At Al-Quds University, these initiatives include the monitoring and reduction of the university’s Scope 2 emissions, which include emissions from the purchased and consumed electricity. This report provides a detailed calculation and breakdown of the analyses of the GHG emissions resulting from electricity consumption at Al-Quds University over the years.
3.2.1 Baseline Year
All the calculations are based on the 2019 data, which is the baseline year and the standard measure. This year allows us to take a snapshot of the university’s operations before the major energy conservation and sustainability initiatives were implemented.
3.2.2 Methodology
For GHG emissions calculations resulting from our electricity consumption, we applied the average emissions factors from the International Energy Agency (IEA). The relevant factor for electricity generation from diesel power plants in non-OECD countries is about 0.7 kg of CO2 per kilowatt-hour (kWh) consumed.
For each relevant year, we gathered the total electricity consumption figures from the electricity invoices issued to Al-Quds University. To estimate the CO2 emissions for each year, we multiplied the electricity consumed (in kWh) by the appropriate emissions factor (in kg CO2/kWh).
This can be captured with the following calculation framework:
CO2 emissions (kg) = Electricity consumption (kWh) x Emission factor (kg CO2/kWh)
3.2.3 Results
The table below presents the annual total electricity consumption alongside the estimated CO2 emissions from 2019 to 2023 for Al-Quds University.
| Year | Electricity Consumption (million kWh) | Estimated GHG Emissions (thousand tCO2e) |
| 2019 | 3.7 | 2.59 |
| 2020 | 3.1 | 2.17 |
| 2021 | 3.2 | 2.24 |
| 2022 | 3.5 | 2.45 |
| 2023 | 3.1 | 2.17 |
The year 2023 serves as an excellent example because detailed calculations can be made as follows:
CO2 emissions (kg) = 3.1 million kWh × 0.7 kg CO2/kWh = 2.17 thousand tonnes CO2
The rest of this report serves Al-Quds University not only as its closure, but as an example of its commitment to GHG emissions reporting and commitment to GHG emissions transparency, Al-Quds University is a more GHG emissions reporting committed to a transparent and more sustainable future. Given the efforts to lower GHG emissions reporting to lower transparency emissions, Al-Quds University is an academic pioneer to environmental responsibility.
3.3 Scope 3 – Other Indirect GHG emissions
These are emissions that occur as a consequence of the activities of the University but from sources not owned or controlled by the University. These contribute to the absence of an institution’s carbon footprint and are not easily quantifiable.
In this inventory, we cover several key categories such as business travel, staff and student commuting, purchased goods and services, waste disposal, usage of ICT equipment, and the associated emissions calculations.
3.3.1 Business Travel
For business travel, modes of transport include an airplane, a train, a personal vehicle and a rented vehicle, and a bus. This information was gathered from the invoices and travel logs. Emission estimations takes into account the distance traveled, the particular mode of transport used, and the pre-established emission factors for the various transport types.
Calculation Methodology: The total distance traveled (in km) was multiplied by an average emission factor of 2.68 kg CO2e/L and an average fuel efficiency of 10 km/L was assumed to estimate GHG emissions.
| Year | Estimated Trips | Average Distance per Trip (km) | Total Distance (km) | GHG Emissions (tCO2e) |
| 2019 | 150 | 400 | 60,000 | 16.08 |
| 2020 | 20 | 100 | 2,000 | 0.536 |
| 2021 | 10 | 100 | 1,000 | 0.268 |
| 2022 | 110 | 400 | 44,000 | 11.792 |
| 2023 | 83 | 400 | 33,200 | 8.8976 |
3.3.2 Student and Staff Commuting
Commuting includes the transportation of students and staff to and from the university. This data is based on records of the university and data collected from surveys. Emissions are quantified based on distance traveled, transport mode, and distance-specific emission factors.
Calculation Methodology: Emissions were calculated based on the distance traveled (in km), average emissions of 2.68 kg CO2e/L, and a fuel efficiency of 10 km/L; this information was used to derive the total CO2e emissions.
| Year | Estimated Commuters | Average Distance per Day (km) | Total Distance (km) | GHG Emissions (tCO2e) |
| 2019 | 9000 | 30 | 77,760,000 | 20839.68 |
| 2020 | 800 | 30 | 6,912,000 | 1852.416 |
| 2021 | 400 | 30 | 3,456,000 | 926.208 |
| 2022 | 7500 | 30 | 64,800,000 | 17366.4 |
| 2023 | 5600 | 30 | 48,384,000 | 12966.912 |
3.3.3 Purchased Goods and Services
This involves items such as paper and electronics. Information was gathered from invoices and records of procurement.
Conversion Method: It is approximated based on global standards from the World Resources Institute (WRI) that every $1,000 spent generates 0.4 tCO2e, thus we will use this estimate for our calculations.
| Year | Total Expenditure ($) | GHG Emissions (tCO2e) |
| 2019 | 9,839,500 | 3935.8 |
| 2020 | 217,380 | 86.952 |
| 2021 | 82,610 | 33.044 |
| 2022 | 8,381,403 | 3352.561 |
| 2023 | 6,286,052 | 2514.4208 |
3.3.4 Waste Disposal
Waste disposal includes both solid waste and wastewater. Data was collected from waste management facilities and invoices. Emissions are computed from the type of waste and the relevant specific emission factors.
Waste disposal emissions depend not only the type of waste, but also the disposal method. For the sake of simplicity, I will use the average factor of 1.5 kg CO2e per kg of waste, also taken from WRI.
| Year | Total Waste (kg) | GHG Emissions (tCO2e) |
| 2019 | 18,000 | 27 |
| 2020 | 4,000 | 6 |
| 2021 | 3,000 | 4.5 |
| 2022 | 15,000 | 22.5 |
| 2023 | 11,000 | 16.5 |
3.3.5 ICT Equipment
Data pertaining to ICT equipment was obtained from the records.
Methodology. GHG emissions was calculated using the formula emissions = energy consumed (kWh) * 0.475 kg CO2e/kWh.
| Year | Number of Devices | Energy Consumption (kWh) | GHG Emissions (tCO2e) |
| 2019 | 850 | 297,500 | 141.3125 |
| 2020 | 420 | 147,000 | 69.825 |
| 2021 | 350 | 122,500 | 58.1875 |
| 2022 | 800 | 280,000 | 133 |
| 2023 | 650 | 227,500 | 108.0625 |
3.3.6 Estimating Scope 3 Emissions
There are unique challenges associated with data collection and estimation pertaining to Scope 3 emissions. The indirect nature of these emissions, along with their range and intricacy, makes the collection of relevant information a daunting task. Notwithstanding these challenges, Al-Quds University is still willing to improve methodologies and refine processes pertaining to the collection of this information.
One challenge was the inconsistent and sparse data, particularly in procurement and waste management. Additionally, the estimation of certain indirect emissions, particularly those associated with commuting of students and employees and contracted service, demanded extensive research and well-founded extrapolation.
Notwithstanding these challenges, Al-Quds University has made remarkable progress in the accuracy and completeness of our Scope 3 emissions data. Al-Quds University has developed new approaches to data collection and estimation, and has begun to engage with partners and stakeholders to obtain reliable and current data.
We adapt international best practices to our local context, continually refining our processes, learning from our experiences, and integrating international best practices into our local context. We are gaining a better understanding of Scope 3 emissions and developing more sophisticated methodologies, and we will continue to revise our GHG Inventory. This effort will provide insights into our emissions and, more importantly, enable us to identify gaps and opportunities, and devise improvements to enhance the sustainability of our community.
3.4 Assessment of Uncertainty
We aim to make our GHG inventory as precise as possible. Still, we recognize that some level of uncertainty regarding any emissions estimation will need to be accepted. Uncertainty, for example, may arise from primary data and how appropriate, precise, and accurate emissions factors are, as well as the methodologies used. We will continue to minimize these uncertainties through advancements in data collection and calculation methodologies, as well as through improvements in emissions estimation methodologies and the GHG reporting frameworks we adopt.
Summary
Al-Quds University’s approach to sustainability actively focuses on improving our GHG emissions inventory. In this context, we will refine our methodologies, ensure the precision of our data, and maintain the expansion of our inventory’s boundaries whenever feasible. In addition, we will seek to implement measures to capture our commitment to reducing emissions through energy efficiency, the procurement of renewable energy, and the promotion of sustainable commuting.
4.1 Summary of 2019 GHG Emissions
Al-Quds University GHG emissions for 2019 is exceedingly high and can be accounted for normal on-campus operations. These entails energy use, using vehicles, and refrigerant use, etc. Given that it is a pre-pandemic year, for GHG emissions level of 2019 serves as a comparator for gauging university emissions during normal operating conditions.
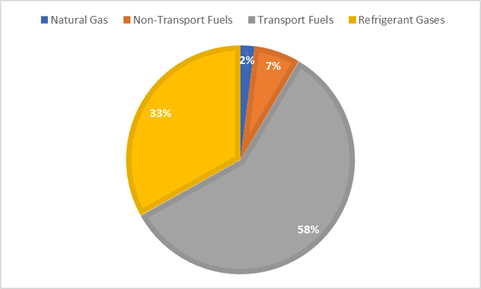
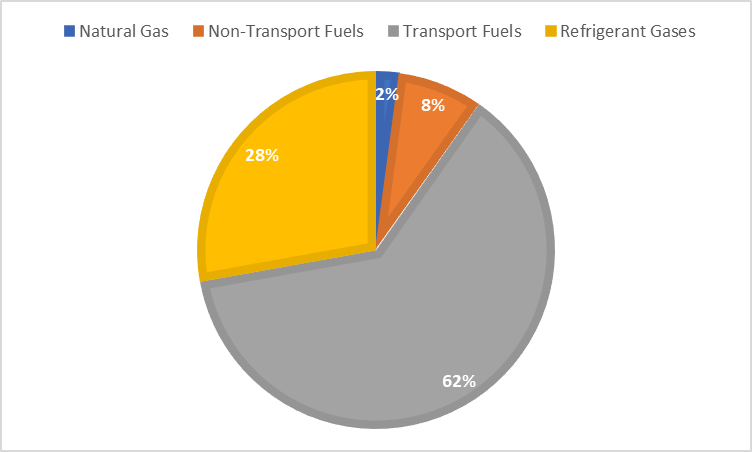
4.1.1 Scope 1 Emissions (tCO2e)
2019 direct emissions were primarily a consequence of the burning of natural gas and diesel for generators, transport fuels and emissions from refrigerants.
| Natural Gas | Non-Transport Fuels | Transport Fuels | Refrigerant Gases | Total GHG emissions (tCO2e) |
| 1.228 | 1.7472 | 13.9776 | 14.62 | 31.5728 |
4.1.2 Scope 2 Emissions (tCO2e)
Indirect emissions from the purchased electricity for all university buildings were considerable and consistent with the standard operating procedures.
| Electricity Consumption (million kWh) | Total GHG emissions (tCO2e) |
| 3.7 | 2590 |
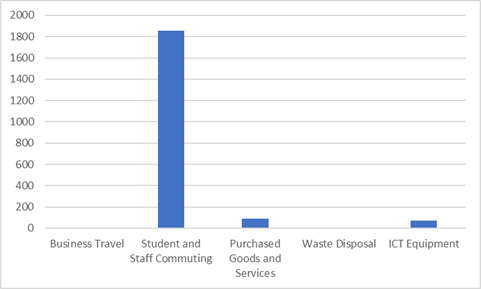
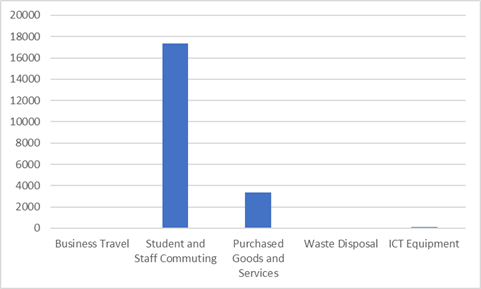
4.1.3 Scope 3 Emissions (tCO2e)
Considering the other indirect emissions associated with business travel, employee commuting, and waste disposal, all of which, prior to the COVID-19 pandemic, were at normal levels.
| Business Travel | Student and Staff Commuting | Purchased Goods and Services | Waste Disposal | ICT Equipment | Total GHG emissions (tCO2e) |
| 16.08 | 20839.68 | 3935.8 | 27 | 141.3125 | 24959.87 |
4.2 Summary of 2020 GHG Emissions
The university experienced its greatest GHG emission reductions during 2020, which was likely the result of the COVID-19 pandemic. The university moved to remote learning, which lowered campus activities to the point where there was little on-site attendance and travel activities were so reduced that there were emission reductions.
4.2.1 Scope 1 Emissions (tCO2e)
The direct-emission reductions were extraordinary, as there were considerable reductions in the consumption of natural gas, diesel, and transport fuels because of remote learning and working.
| Natural Gas | Non-Transport Fuels | Transport Fuels | Refrigerant Gases | Total GHG emissions (tCO2e) |
| 1.228 | 0.253 | 0.34944 | 4.8384 | 0.8352 |
4.2.2 Scope 2 Emissions (tCO2e) 4.2.2
There was a significant decrease in Scope 2 emissions as a result of decreased electricity use during the campus closure.
| Electricity Consumption (million kWh) | Total GHG emissions (tCO2e) |
| 3.1 | 2170 |
4.2.3 Scope 3 Emissions (tCO2e)
The restrictions on travel and the transition to remote meetings resulted in a decline in Scope 3 emissions associated with business travel and commuting.
| Business Travel | Student and Staff Commuting | Purchased Goods and Services | Waste Disposal | ICT Equipment | Total GHG emissions (tCO2e) |
| 16.08 | 0.536 | 1852.416 | 86.952 | 6 | 69.825 |
4.3 Summary of 2021 GHG Emissions
The continued emissions lower trend in 2021 can be explained by lower restrictions of the pandemic and the continued implementation of remote learning. This year also experienced less travel and activities on campus, lower energy use, and thus, lower emissions in comparison to the pre-pandemic year of 2019.
4.3.1 Scope 1 Emissions (tCO2e)
The direct emissions saw a reflection of the lower on campus activities in 2021, thus, remaining low.
| Natural Gas | Non-Transport Fuels | Transport Fuels | Refrigerant Gases | Total GHG emissions (tCO2e) |
| 0.144 | 0.48384 | 4.3008 | 2.44206 | 7.3707 |
4.3.2 Scope 2 Emissions (tCO2e)
The partial campus closures throughout the year resulted in low electricity consumption and, subsequently, lower Scope 2 emissions.
| Electricity Consumption (million kWh) | Total GHG emissions (tCO2e) |
| 3.2 | 2240 |
4.3.3 Scope 3 Emissions (tCO2e)
As business travel continued to be minimal, there was only a slight increase in Scope 3 emissions attributed to commuting during the easing of restrictions.
| Business Travel | Student and Staff Commuting | Purchased Goods and Services | Waste Disposal | ICT Equipment | Total GHG emissions (tCO2e) |
| 0.268 | 926.208 | 33.044 | 4.5 | 58.1875 | 1022.208 |
4.4 Summary of 2022 GHG Emissions
With the return of the pandemic’s ease in 2022, the university shifted back to its normal activities. As expected, GHG emissions were higher post-pandemic. While GHG emissions were higher, the energy and remote operations fuel use lessons learned during the pandemic can be valuable for future the future sustainability focus.
4.4.1 Scope 1 Emissions (tCO2e)
As the use of natural gas and diesel for on-site activities grew, so did the use of transport and fuel in the university. Hence, direct emissions grew as the operations shifted back to on-site learning and working.
| Natural Gas | Non-Transport Fuels | Transport Fuels | Refrigerant Gases | Total GHG emissions (tCO2e) |
| 0.614 | 1.26336 | 11.5584 | 7.6869 | 21.12266 |
4.4.2 Scope 2 Emissions (tCO2e)
There was an increase in Scope 2 emissions because electricity consumption spiked when buildings opened up again.
| Electricity Consumption (million kWh) | Total GHG emissions (tCO2e) |
| 3.5 | 2450 |
4.4.3 Scope 3 Emissions (tCO2e)
With the return of the community to the campus and the resumption of business travel, Scope 3 emissions increased. Nevertheless, the use of online meeting platforms and other online learning activities mitigated some of this increase.
| Business Travel | Student and Staff Commuting | Purchased Goods and Services | Waste Disposal | ICT Equipment | Total GHG emissions (tCO2e) |
| 11.792 | 17366.4 | 3352.561 | 22.5 | 133 | 20886.25 |
4.5 Summary of 2023 GHG Emissions
In 2023, Al-Quds University exercised greater dominion over its emissions in all three scopes. Here is a summary of the emissions calculations conducted for the year 2023.
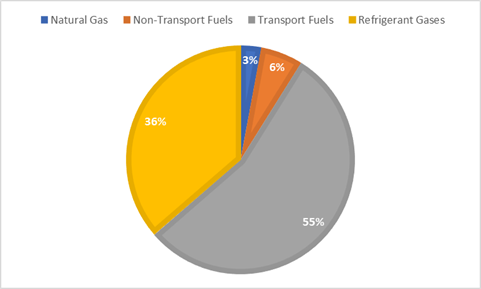
4.5.1 Scope 1 Emissions (tCO2e)
As for Scope 1 emissions on the university’s campus, there was a slight reduction in emissions in 2023. This reflects an improvement, however, slight, in the management of direct emissions from facilities owned or operated by the university.
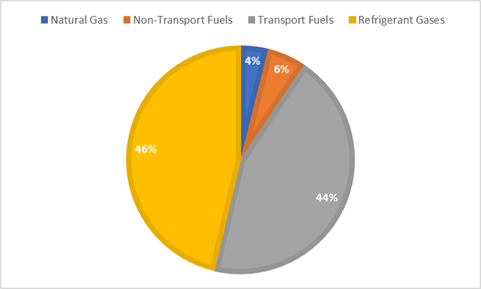
| Natural Gas | Non-Transport Fuels | Transport Fuels | Refrigerant Gases | Total GHG emissions (tCO2e) |
| 0.433 | 1.58592 | 12.9024 | 5.7502 | 20.67152 |
4.5.2 Scope 2 Emissions (tCO2e)
Regarding Scope 2 emissions, Al-Quds University has shown a reduction in 2023 compared to 2022. This reflects better energy efficiency improvements in the consumption of externally provided electricity, steam, heating, and cooling.
| Electricity Consumption (million kWh) | Total GHG emissions (tCO2e) |
| 3.1 | 2170 |
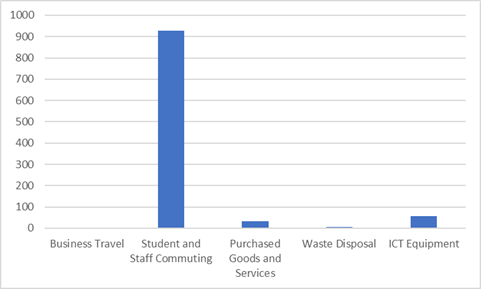
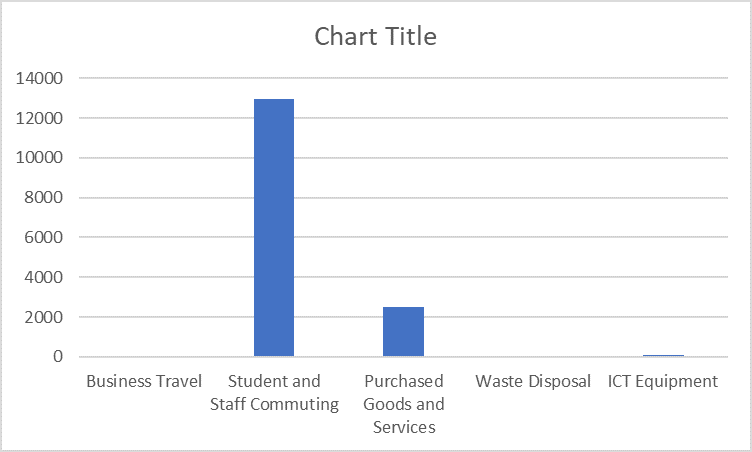
4.5.3 Scope 3 Emissions (tCO2e)
In Scope 3 Emissions, Al-Quds University demonstrated, emissions reductions in 2023 relative to the previous year.
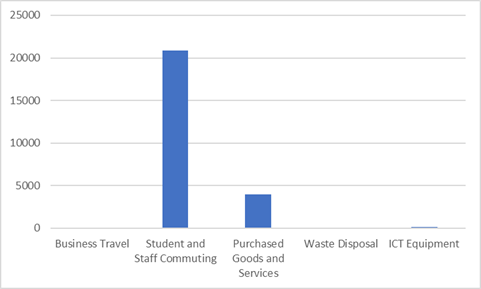
| Business Travel | Student and Staff Commuting | Purchased Goods and Services | Waste Disposal | ICT Equipment | Total GHG emissions (tCO2e) |
| 8.8976 | 12966.912 | 2514.4208 | 16.5 | 108.0625 | 15614.7929 |
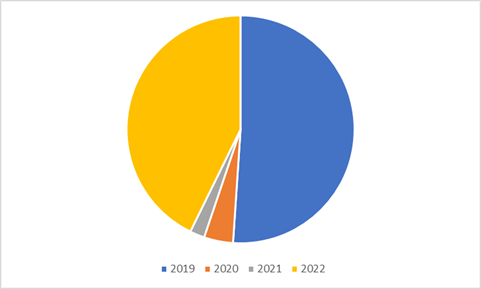
4.6 Total Summary of GHG Emissions (2019-2023)
Over the review period of five years, the tables and figures below demonstrate the carbon emissions relative to the three scopes at Al-Quds University. The emission values were and continue to be inconsistent primarily due to the repercussions of the COVID-19 pandemic. However, the last two years indicate a greater managerial control over the carbon emissions, with the situation stabilizing.
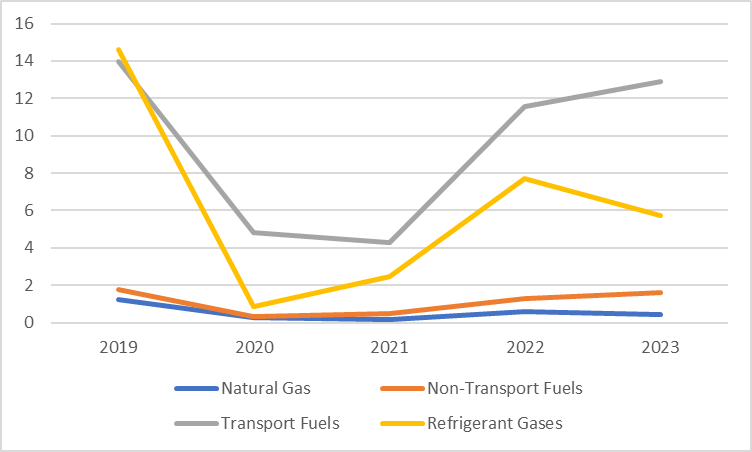
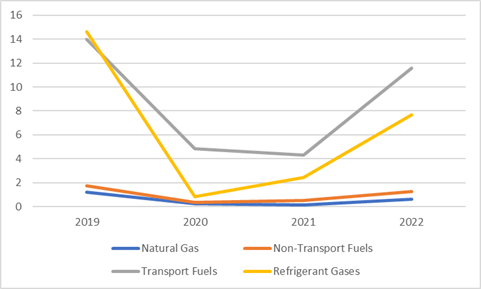
4.6.1 Scope 1 – Direct Emissions
During this period, natural gas, diesel, transport fuels, and refrigerant gases contributed to the Scope 1 direct GHG emissions of the university. The emissions decreased considerably in 2020 and 2021 due to the pandemic, which limited in-person activities at the university and triggered a fully online operation. Scope 1 emissions rose considerably in 2022 as COVID restrictions were eased, and the university fully resumed normal activities. Emissions declined this time, but slightly in 2023, relative to the year before.
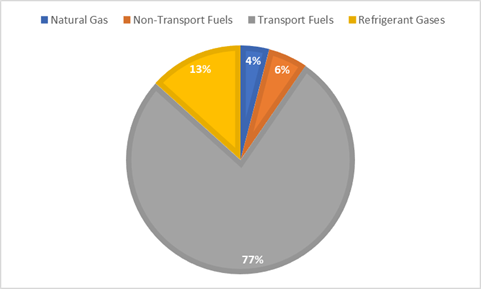
| Year | Natural Gas | Non-Transport Fuels | Transport Fuels | Refrigerant Gases | Total GHG emissions (tCO2e) |
| 2019 | 1.228 | 1.7472 | 13.9776 | 14.62 | 31.5728 |
| 2020 | 0.253 | 0.34944 | 4.8384 | 0.8352 | 6.27604 |
| 2021 | 0.144 | 0.48384 | 4.3008 | 2.44206 | 7.3707 |
| 2022 | 0.614 | 1.26336 | 11.5584 | 7.6869 | 21.12266 |
| 2023 | 0.433 | 1.58592 | 12.9024 | 5.7502 | 20.67152 |
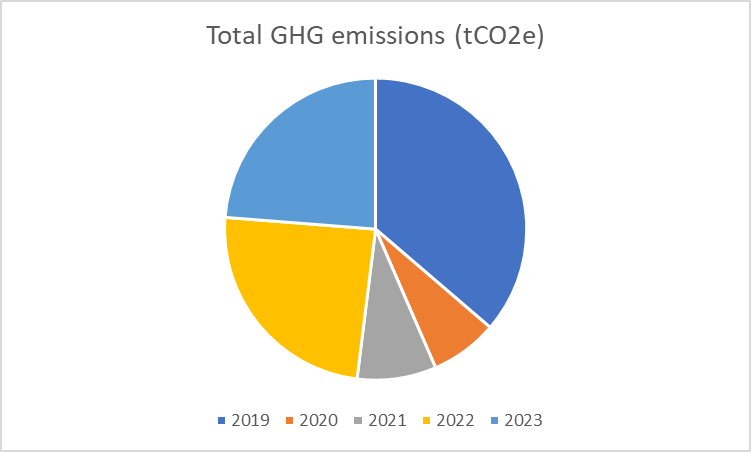
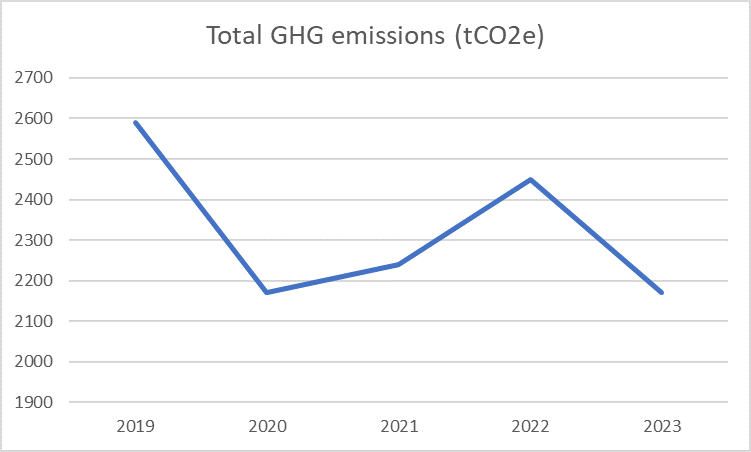
4.6.2 Scope 2 – Indirect Emissions
In 2020 and part of 2021 emissions associated with indirect emissions as a result of electricity usage within UG buildings diminished considerably because of the closure of the university. Emissions level as a result of the reopening in 2022. However, 2023 showed these emissions as a result of improved control measures and management of activities decreased.
| Year | Electricity Consumption (million kWh) | Total GHG emissions (tCO2e) |
| 2019 | 3.7 | 2590 |
| 2020 | 3.1 | 2170 |
| 2021 | 3.2 | 2240 |
| 2022 | 3.5 | 2450 |
| 2023 | 3.1 | 2170 |
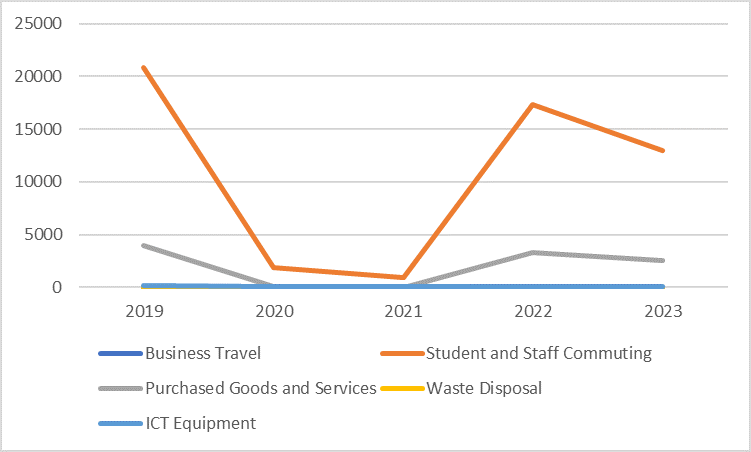
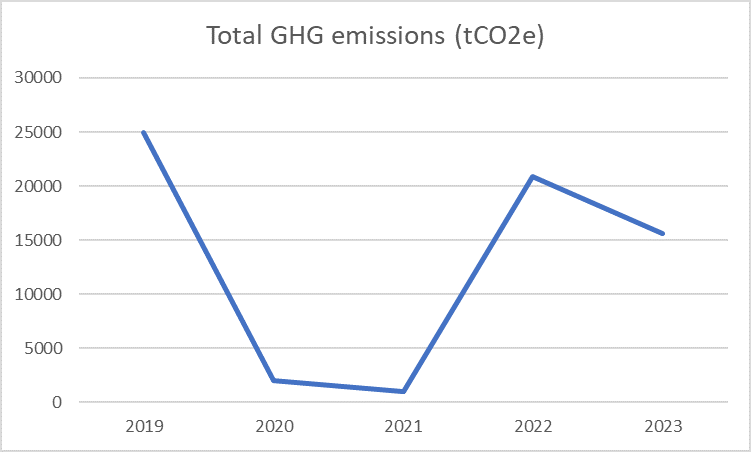
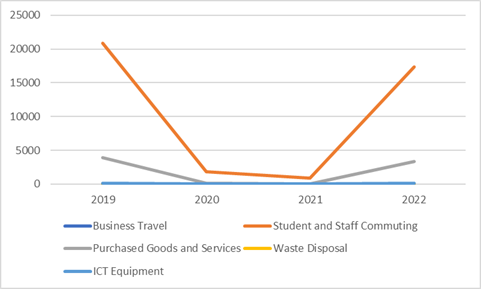
4.6.3 Scope 3 – Other Indirect Emissions
At Al-Quds University, other indirect emissions caused especially by business travel, commuting, and waste disposal significantly dropped during the 2020-2021 pandemic period. There was, however, an increase in 2022. The relative Scope 3 emissions during 2022 were still lower than in the years immediately preceding the pandemic as a result of the continued use of online platforms. In 2023, there was a further reduction in total Scope 3 emissions relative to the previous year. This reflects the University’s continued efforts to reduce the emissions.
| Year | Business Travel | Student and Staff Commuting | Purchased Goods and Services | Waste Disposal | ICT Equipment | Total GHG emissions (tCO2e) |
| 2019 | 16.08 | 20839.68 | 3935.8 | 27 | 141.3125 | 24959.87 |
| 2020 | 0.536 | 1852.416 | 86.952 | 6 | 69.825 | 2015.729 |
| 2021 | 0.268 | 926.208 | 33.044 | 4.5 | 58.1875 | 1022.208 |
| 2022 | 11.792 | 17366.4 | 3352.561 | 22.5 | 133 | 20886.25 |
| 2023 | 8.8976 | 12966.912 | 2514.4208 | 16.5 | 108.0625 | 15614.7929 |
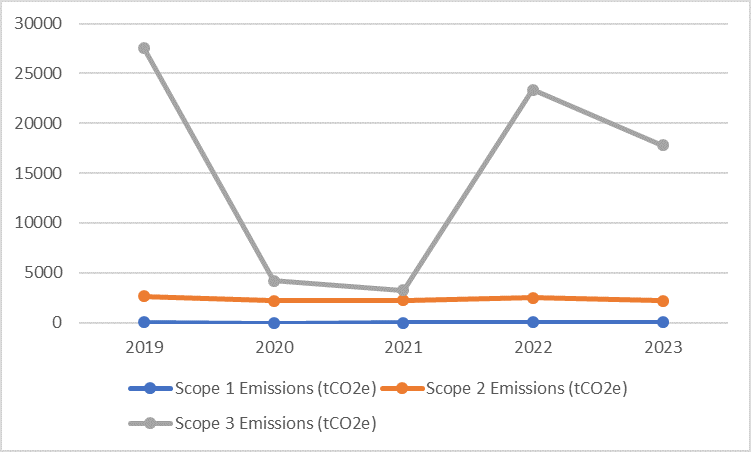
4.6.4 Scope 1, 2, and 3 Emissions (tCO2e)
The table below presents a comparative summary of our GHG emissions for the last five years:
| Year | Scope 1 Emissions (tCO2e) | Scope 2 Emissions (tCO2e) | Scope 3 Emissions (tCO2e) |
| 2019 | 31.5728 | 2590 | 24959.87 |
| 2020 | 6.27604 | 2170 | 2015.729 |
| 2021 | 7.3707 | 2240 | 1022.208 |
| 2022 | 21.12266 | 2450 | 20886.25 |
| 2023 | 20.67152 | 2170 | 15614.7929 |
4.7 Total Summary of GHG Emissions (2019-2022) – Old Summary March 2023
In the four years between 2019-2022 the total GHG emissions for Al-Quds University displayed a variable trend, mostly because of the impacts of the COVID-19 pandemic.
4.7.1 Scope 1 – Direct Emissions
Between 2019-2022, the main contributors to the direct GHG emissions were the consumption of natural gas, diesel for vehicles, the fuel for transport, and the refrigerant gases. 2020 and 2021 saw a notable drop in Scope 1 emissions because of the pandemic which limited activities to mostly online. 2022 saw an increase in Scope 1 emissions significantly due to the normalisation of operations after a period of COVID-19 restrictions.
| Year | Natural Gas | Non-Transport Fuels | Transport Fuels | Refrigerant Gases | Total GHG emissions (tCO2e) |
| 2019 | 1.228 | 1.7472 | 13.9776 | 14.62 | 31.5728 |
| 2020 | 0.253 | 0.34944 | 4.8384 | 0.8352 | 6.27604 |
| 2021 | 0.144 | 0.48384 | 4.3008 | 2.44206 | 7.3707 |
| 2022 | 0.614 | 1.26336 | 11.5584 | 7.6869 | 21.12266 |
4.7.2 Scope 2 – Indirect Emissions
Indirect emissions were primarily results of the consumption of electricity for the University buildings. The University campus closure during 2020 and part of 2021 resulted in a considerable decrease in the Scope 2 emissions. Conversely, emissions levelled up as the campus reopened during 2022.
| Year | Electricity Consumption (million kWh) | Total GHG emissions (tCO2e) |
| 2019 | 3.7 | 2590 |
| 2020 | 3.1 | 2170 |
| 2021 | 3.2 | 2240 |
| 2022 | 3.5 | 2450 |
4.7.3 Scope 3 – Other Indirect Emissions
Other indirect emissions primarily stemmed from business travel, commuting, and waste disposal. There was a significant decline in these activities during the COVID-19 pandemic, particularly in 2020 and 2021. Although there was an increase in these emissions during 2022, the continued utilization of online platforms for certain activities during and after the pandemic has helped to keep Scope 3 emissions below pre-pandemic levels.
| Year | Business Travel | Student and Staff Commuting | Purchased Goods and Services | Waste Disposal | ICT Equipment | Total GHG emissions (tCO2e) |
| 2019 | 16.08 | 20839.68 | 3935.8 | 27 | 141.3125 | 24959.87 |
| 2020 | 0.536 | 1852.416 | 86.952 | 6 | 69.825 | 2015.729 |
| 2021 | 0.268 | 926.208 | 33.044 | 4.5 | 58.1875 | 1022.208 |
| 2022 | 11.792 | 17366.4 | 3352.561 | 22.5 | 133 | 20886.25 |
4.7.4 Scope 1,2, and 3 Emissions (tCO2e)
The following table provides a comparative snapshot of our GHG emissions over the past four years:
| Year | Scope 1 Emissions (tCO2e) | Scope 2 Emissions (tCO2e) | Scope 3 Emissions (tCO2e) |
| 2019 | 31.5728 | 2590 | 24959.87 |
| 2020 | 6.27604 | 2170 | 2015.729 |
| 2021 | 7.3707 | 2240 | 1022.208 |
| 2022 | 21.12266 | 2450 | 20886.25 |
To conclude, we emphasize the value we place on sustainability and environmental accountability. Our adherence to the GHG Protocol Corporate Standard and periodic carbon inventory reflections demonstrate our commitment to working towards sustainability at Al-Quds University and beyond.